
Are Infographics Right for Your Business? The Pros, Cons + Tips
Infographics are creative, educational, attention-grabbing and can be a powerful marketing tool, but are they right for your small business? To help you answer that question, we explain the pros and cons. and have actionable tips to get started.
The pros
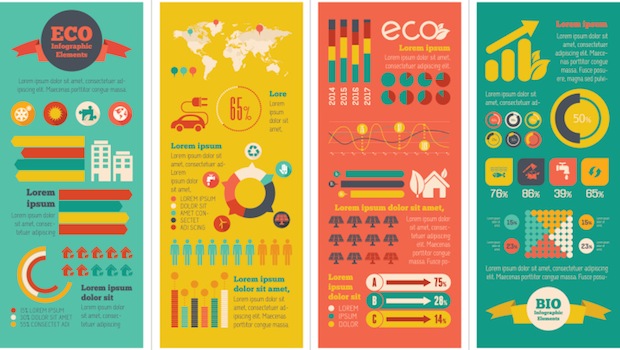
Infographics serve as great pieces of content marketing. They can relay otherwise dry statistics in a more compelling way, are super shareable and can help readers visualize information and relationships. Take a look at the example below. Statistics come to life. They’re easy to interpret, explains Carla Mattioli, a creative consultant with IM Design.
“As a graphic designer, it’s my job to produce layouts that will capture a reader’s attention,”she explains. “In this world of instant gratification, infographics allow me to display facts and figures in a way that satisfies an audience’s need for quick and easy-to-read information.”
Infographics also:
- Diversify your marketing tools
- Appeal to visual learners in your audience
- Increase social engagement as your followers share your infographic
The cons
In most cases, good infographics require a bit of design experience. After all, there’s an art to relaying a lot of information in a small space. It’s not just about choosing precise wording or statistics; it’s also about placement, color choices, font size, style and images.
We know that a lot of small business owners may not have an in-house graphics or creative team, or the resources to hire a specialist. For a lot of small businesses, that’s the major downside to creating infographics. However, there are DIY tools that can help.
DIY infographics tools
If you’d like to try creating infographics yourself, there here are a few tools to use.
- Piktochart allows you to pick themes from its gallery, customize your infographic with intuitive editing tools and share it on social media or export it to SlideShare or Evernote.
- Easel.ly is a free web-based tool that allows you to choose from infographic templates, then customize them in an easy-to-understand format.
- Venngage not only offers tools for creating and publishing infographics, but it also allows you to animate them.
 Types of infographics
To create an infographic doesn’t mean you must only use stats and data. So what should or can you create infographics about? Here are some angles:
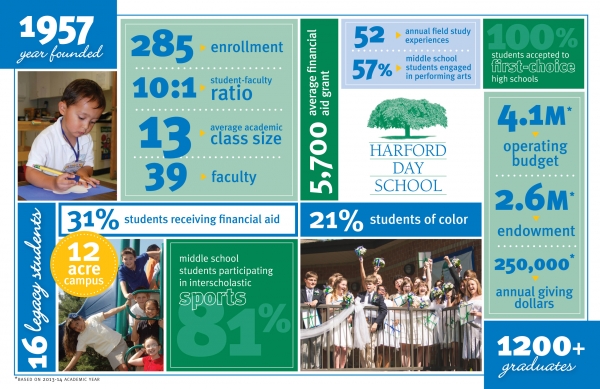
- Educational: Educate your audience. For example, non-profits can create a timeline that explains how the organization got its start. Service-based businesses can showcase information from a survey that highlights customer satisfaction. We’ve created several educational infographics portraying a variety of digital marketing best practices.
- How-to: Teach your audience a skill. For example, this infographic explains how to clean out a dog’s ears. In this example, a lighting company explains how to layout recessed lighting.
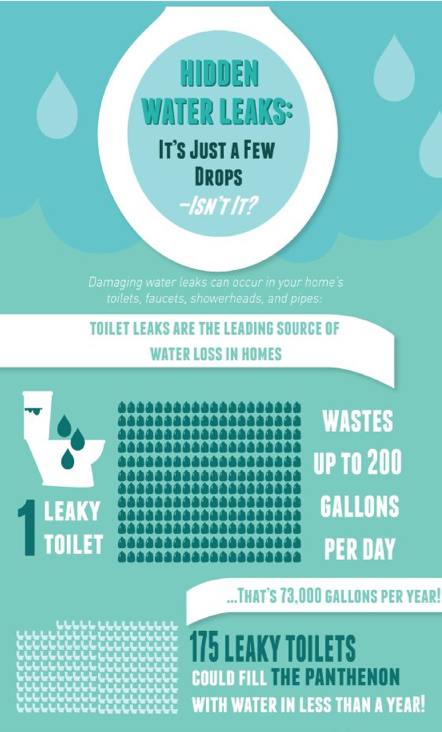
- Statistics: Any time you have a glut of numbers, make them easy to digest in an infographic. For example, non-profits can breakdown donation statistics. Small businesses can highlight common problems like this plumbing company does.
- Comparison: Compare statistics. A non-profit, for example, could compare the level of need in the community today versus five years ago. A small business could compare the cost of materials to help customers make an informed decision.
- Guides: Create a visual guide. Consider making a beginner’s guide to a topic that’s relevant to your business or nonprofit. Here’s a Beginner’s Guide to Sushi.
Is your business or nonprofit creating infographics? If so, how? Tell us in the comments section below.
Wendy Burt-Thomas is a full-time freelance writer with four books and thousands of published articles to her credit. Contact Wendy at WendyBurt@aol.com.
© 2014 – 2018, Contributing Author. All rights reserved.


 Features
 Pricing
 Partner
 Blog
Blog Support
 More
More Terms of Services
 Privacy Policy
We use infographics to explain technical printing terms and processes to our customers so that they can make informed decisions and comprehend why and what they are buying.
They also serve as customer service tools and as an internal tool to reduce reprints/returns from misunderstandings and unexpected problems.
https://visual.ly/printing-terms-color-quick-guide **********************************
We also create chart-type infographics that help our customers choose the correct sizes to avoid surprises.
https://visual.ly/envelope-size-chart-quick-guide *********************************